- Yeniliklerimiz
- PCI kullanımı ile ilgili makaleler
- Yeni Fırsatlar
Portföy Kotelenme Metodu - Ticaret enstrümanları aralığının genişletilmesi
Aktif olarak finansal piyasalarda ticari işlemler yapan birçok trader için geniş sayıda ticaret enstrümanlarının varlığı çok önemlidir. Kişinin geliştirilmiş ticaret sistemi (bazı tekrarlayan grafik görüntülerini tanıma tabanlı mekanik veya görsel) varsa, o zaman ne kadar çok enstrüman varsa, piyasaya girmek için o kadar çok fırsat olabilir.
Trader'ler için Yeni Fırsatlar
Bu yazıda kısaca trader’lere zaten mevcut ticaret enstrümanları listesinden tamamen yeni ticari varlıklar ve hatta varlık portöyleri oluşturmak için ticaret enstrümanları, kapsamını genişletme olanağını tanıyan Portföy Kotelenme Metodu olarak adlandırılan yeni bir fonksiyonel hakkında anlatılacaktır. Yukarıda belirtilen fonksiyonel ticari-analitik platform NetTradeX’in en son sürümünde kullanılabilir hale gelmiştir.
Metodun Benzersizliği
PQM, platformda mevcut finansal enstrümanlardan çeşitli varlık portföyleri oluşturma ve başka birinin fiyatına göre bir portföyün fiyatını belirleme, böylelikle yeni ve benzersiz bir sentetik enstrüman oluşturabilme olanakları tanıyan yenilikçi bir piyasa analizi yöntemidir. Metodun ideolojisi Forex piyasasında kabul edilen B/Q işlem gören çift kavramına dayanır, ki burada B (baz) varlık Q (karşıt) varlığa karşı işlem görür (karşılaştırılır). Üstelik hem her portföyün sadece bir varlık içerdiği çok basit yapılı, hem de her portföyün çok sayıda varlık içerdiği karmaşık kompozit enstrümanlar oluşturmak mümkündür. Program genel yapıda varlıkların her birine özel bir ağırlık ayarlamanızı sağlar. Tüm varlıkların fiyatları otomatik olarak ABD Doları olarak hesaplanır (eğer başka bir para birimi ile ifade edilmişse), ki bu iki portföylerin fiyatlarını doğru şekilde karşılaştırmanızı sağlar. Önceden oluşturulmuş PCI temelinde grafik oluşturmak en fazla iki dakika sürer.
Example of Appliance
Let us give a concrete example of how to apply PCI for selecting new trading instruments. In the list of instruments in use there are CFDs on Stock Indices of the USA (DJI), of European countries, such as England
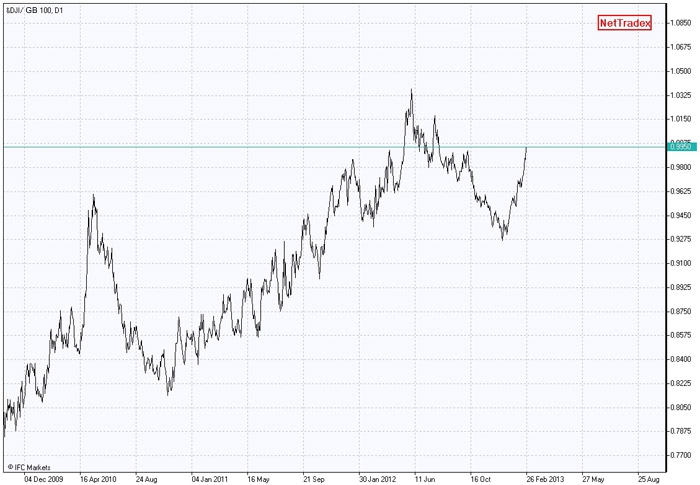
(GB 100) and France (FR 40). We can trade an index directly as well as build a chart reflecting changing relation between the indices and trade with that relation. In the charts presented below we have derived the relation of DJI against GB 100
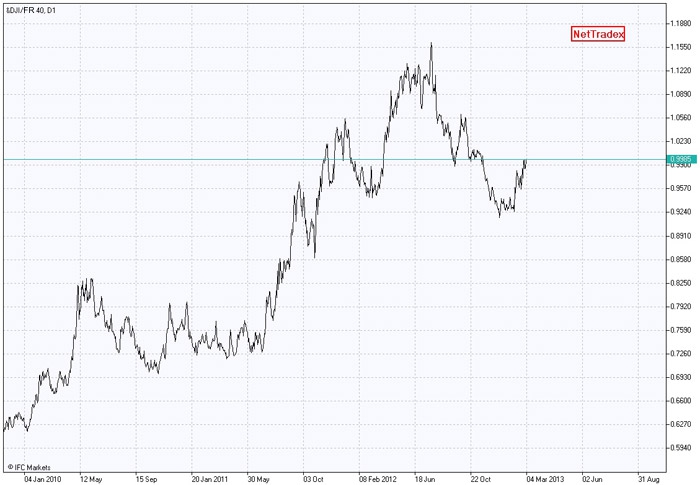
and DJI against FR 40.
The prices of all indices have been equaled to 100 000 US dollars.
From a fundamental point of view, the stronger the economy of the country is, the more stable and better its stock index should be, compared with a weaker economy.
This hypothesis is confirmed by the charts presented. A stable upward trend is observed on the relation of DJI against the European indices, which is interrupted by rare but rather deep corrections (15-20%). This analysis can well be used as a trading idea, by buying DJI and simultaneously selling any of the European indices, and probably increasing positions on strong corrections.
The fundamental analysis should certainly be reinforced by the technical analysis, and NetTradeX possesses an arsenal of all necessary means. The movement on both charts takes place quite synchronously, which allows to determine trend continuation or possible correction at earlier stages. At the beginning of 2013 on both charts some reversal patterns emerged, very similar to “head and shoulders”, which signaled about long positions to be closed.
So, the fundamental approach in combination with the abilities of the technical analysis leads to a better understanding of portfolio behavior and explanation of the relationships between various asset combinations. In this regard, PCI, developed on the platform NetTradeX, is a very effective instrument for people, engaged in active trading.


Önceki makaleler
- Kur ve Onun Temelinde Yeni Enstrümanların Oluşturulması
- Profiting in bear and bull oil markets
- Döviz endeksleri: merkez bankalarının kartlarını açığa çıkarıyoruz
- Ters spread ile çifti ticaret: anlayış için 3 adım
- Portföy Kotelenme Metodu - Finansal Piyasalar Analizinin Yeni Yolları
- Portfolio Quoting Method - New Trading Strategies
