- Analiz
- Teknik analiz
EU 50 Index Teknik Analiz - EU 50 Index Ticaret: 2020-08-14
Euro Stocks 50 Index Teknik Analiz Özeti
Above 3380.50
Buy Stop
Below 3156.91
Stop Loss
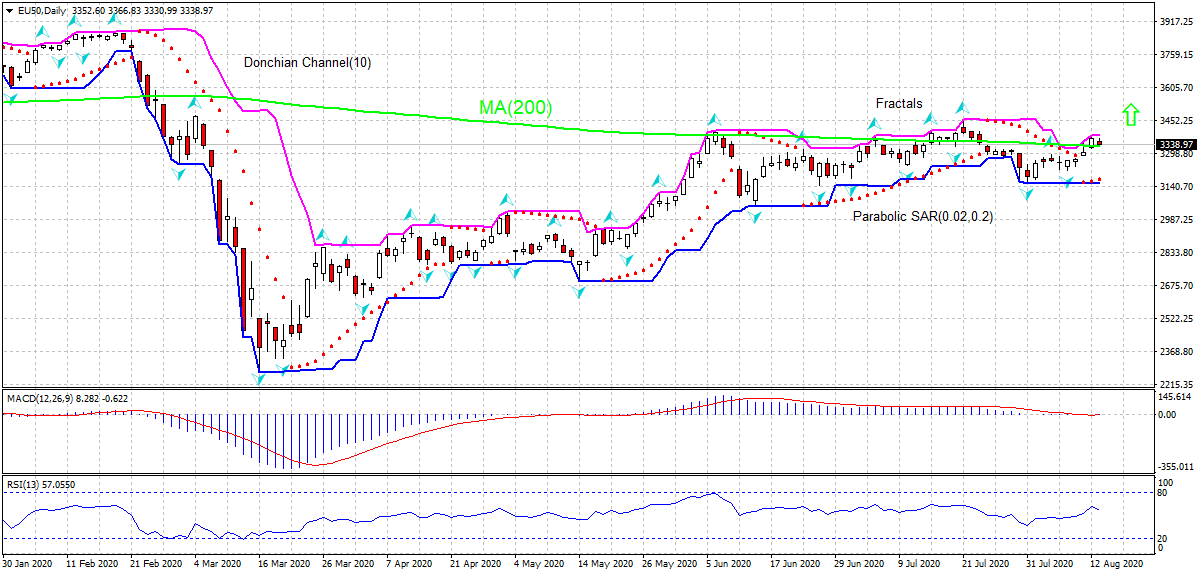
| Gösterge | Sinyal |
| RSI | Nötr |
| MACD | AL |
| Donchian Channel | Nötr |
| MA(200) | AL |
| Fractals | Nötr |
| Parabolic SAR | AL |
Euro Stocks 50 Index Grafik analizi
Euro Stocks 50 Index Teknik analiz
On the daily timeframe the EU50: D1 is testing the 200-day moving average MA(200) which has leveled off. We believe the bullish momentum will continue after the price breaches above the upper boundary of Donchian channel at 3380.50. A level above this can be used as an entry point for placing a pending order to buy. The stop loss can be placed below 3156.91. After placing the order, the stop loss is to be moved every day to the next fractal low, following Parabolic signals. Thus, we are changing the expected profit/loss ratio to the breakeven point. If the price meets the stop loss level (3156.91) without reaching the order (3380.50), we recommend cancelling the order: the market has undergone internal changes which were not taken into account
Temel analiz Endeksler - Euro Stocks 50 Index
Euro-zone’s economic reports were mostly positive recently. Will the EU50 rebound continue?
Euro-zone economic data in the recent couple of weeks were positive on balance. While industrial production increase in June was not as steep as expected, the retail sales growth of 1.3% over year was above an expected decline of 0.5%. Both manufacturing and services sectors resumed expanding in July according to Markit’s manufacturing and services PMIs reports, and construction sector contraction slowed as evidenced by construction PMI reading of 48.9 after 48.3 in June. Readings above 50.0 indicate industry expansion, below indicate contraction. Improving data are bullish for EU50. On the other hand, second estimate of Q2 GDP report will be published today at 13:00 CET, and a steep drop in gross domestic report is expected. Worse than expected GDP report is a downside risk for EU50.
Not:
Bu bilgilendirici ve eğitici bir genel bakıştır ve ücretsiz olarak yayımlanmaktadır. Burada yer alan tüm veriler kamu kaynaklarından alınmış ve az çok güvenilir olarak kabul edilmiştir. Aynı zamanda, bilgilerin tam ve doğru olduğuna dair hiçbir garanti yoktur. Gelecekte bunlar güncellenmemektedirler. Görüşler, göstergeler, grafikler ve kalan her şey dahil olmak üzere her genel bakışta olan tüm bilgiler sadece değerlendirme amacıyla sağlanıp mali dalışmanlık veya tavsiye niteliğinde değildirler. Tüm metin ve onun herhangi bir bölümünü veya grafikleri herhangi bir varlıkla işlem yapmak için bir teklif olarak kabul edilemez. IFC Markets şirketi ve şirket çalışanları bu genel bakışın incelenmesi sırasında veya sonrasında başkası tarafından alınan herhangi bir eylem için hiçbir koşulda sorumlu değildir.


