- Analiz
- Teknik analiz
AUD/USD Teknik Analiz - AUD/USD Ticaret: 2024-10-30
AUD/USD Teknik Analiz Özeti
Below 0.65363
Sell Stop
Above 0.66034
Stop Loss
| Gösterge | Sinyal |
| RSI | AL |
| MACD | Sat |
| Donchian Channel | Sat |
| MA(200) | Sat |
| Fractals | Sat |
| Parabolic SAR | Sat |
AUD/USD Grafik analizi
AUD/USD Teknik analiz
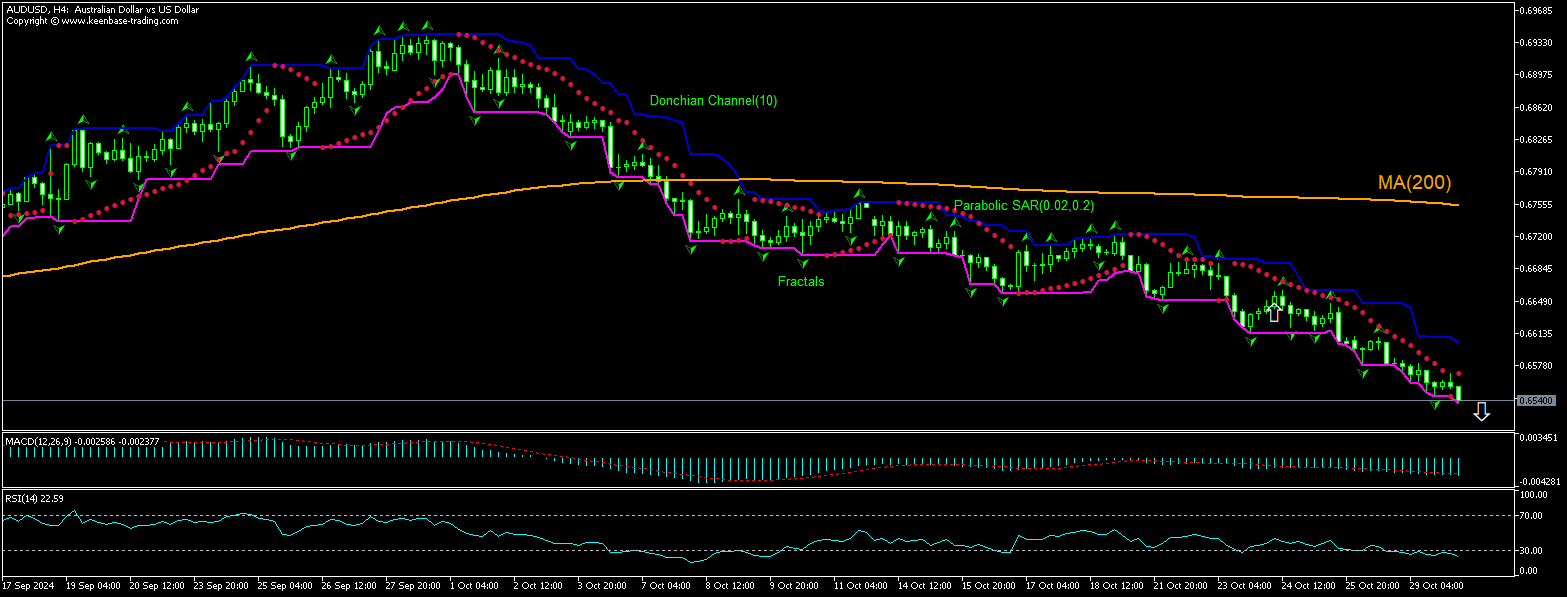
The technical analysis of the AUDUSD price chart on 4-hour timeframe shows AUDUSD,H4 is retracing lower under the 200-period moving average MA(200) which is declining itself. RSI is in oversold zone. We believe the bearish momentum will continue after the price breaches below the lower bound of the Donchian channel at 0.65363. A level below this can be used as an entry point for placing a pending order to sell. The stop loss can be placed above 0.66034. After placing the order, the stop loss is to be moved to the next fractal high indicator, following Parabolic signals. Thus, we are changing the expected profit/loss ratio to the breakeven point. If the price meets the stop loss level without reaching the order, we recommend cancelling the order: the market has undergone internal changes which were not taken into account.
Temel analiz Pariteler - AUD/USD
Australia’s latest inflation data were weaker than expected. Will the AUDUSD price retreating persist?
Australian Bureau of Statistics latest inflation data were weaker than expected: consumer price index growth declined to 2.1% over year in September after 2.7% growth in August when a decline to 2.3% was forecast. The component with highest contribution to price increases was Alcohol and tobacco followed by Food and non-alcoholic beverages, rising 6.3% and 3.3% respectively. The increase in the index excluding volatile items and holiday travel was 2.7% over year in September, down from a 3.0% rise in August. Slower than expected Australian consumer prices inflation is bearish for Australian dollar and hence for AUDUSD pair.
Not:
Bu bilgilendirici ve eğitici bir genel bakıştır ve ücretsiz olarak yayımlanmaktadır. Burada yer alan tüm veriler kamu kaynaklarından alınmış ve az çok güvenilir olarak kabul edilmiştir. Aynı zamanda, bilgilerin tam ve doğru olduğuna dair hiçbir garanti yoktur. Gelecekte bunlar güncellenmemektedirler. Görüşler, göstergeler, grafikler ve kalan her şey dahil olmak üzere her genel bakışta olan tüm bilgiler sadece değerlendirme amacıyla sağlanıp mali dalışmanlık veya tavsiye niteliğinde değildirler. Tüm metin ve onun herhangi bir bölümünü veya grafikleri herhangi bir varlıkla işlem yapmak için bir teklif olarak kabul edilemez. IFC Markets şirketi ve şirket çalışanları bu genel bakışın incelenmesi sırasında veya sonrasında başkası tarafından alınan herhangi bir eylem için hiçbir koşulda sorumlu değildir.


