- Education
- Forex Technical Analysis
- Chart Patterns
- Continuation Patterns
- Ascending Triangle Pattern
Ascending Triangle: Ascending Pattern in Trading
Chart patterns are visual representations of price movements in financial markets, often seen on trading charts. They provide traders with valuable insights into potential future price trends based on historical price data.
These patterns emerge as traders react to various market forces, such as supply, demand, economic news, and investor sentiment. Analyzing chart patterns can help traders make more informed decisions and anticipate potential price movements.
There are two main types of chart patterns: continuation patterns and reversal patterns. Continuation patterns suggest that the ongoing trend is likely to continue, while reversal patterns indicate a potential change in trend direction.
How to use Ascending Triangle Pattern in trading platform
Learn how to create Ascending Triangle Pattern in trading platform, by watching a video.
Traders use Forex chart patterns for several reasons:
- Identifying Trends: Chart patterns can help traders identify whether an asset is in an uptrend, downtrend, or ranging market. This understanding allows traders to align their strategies with the prevailing market sentiment.
- Predicting Price Movements: By recognizing patterns that tend to precede certain price movements, traders can anticipate potential future price actions. This helps them make more accurate predictions about where prices might go next.
- Risk Management: Chart patterns can aid in setting entry and exit points for trades. Traders often use specific patterns to determine where to place stop-loss and take-profit orders, helping them manage risk effectively.
- Confirmation of Analysis: Traders often use chart patterns to confirm other forms of technical or fundamental analysis. When multiple indicators align, it can provide stronger signals for making trading decisions.
- Market Psychology: Chart patterns reflect the psychology of market participants. Understanding how patterns form and the emotions they represent (such as fear, greed, or indecision) can offer insights into market dynamics.
Common chart patterns include:
Traders use chart patterns for several reasons:
- Head and Shoulders: A reversal pattern consisting of three peaks, with the middle peak (the head) being higher than the other two (the shoulders).
- Double Top/Bottom: A reversal pattern formed by two consecutive peaks (double top) or troughs (double bottom) at roughly the same price level.
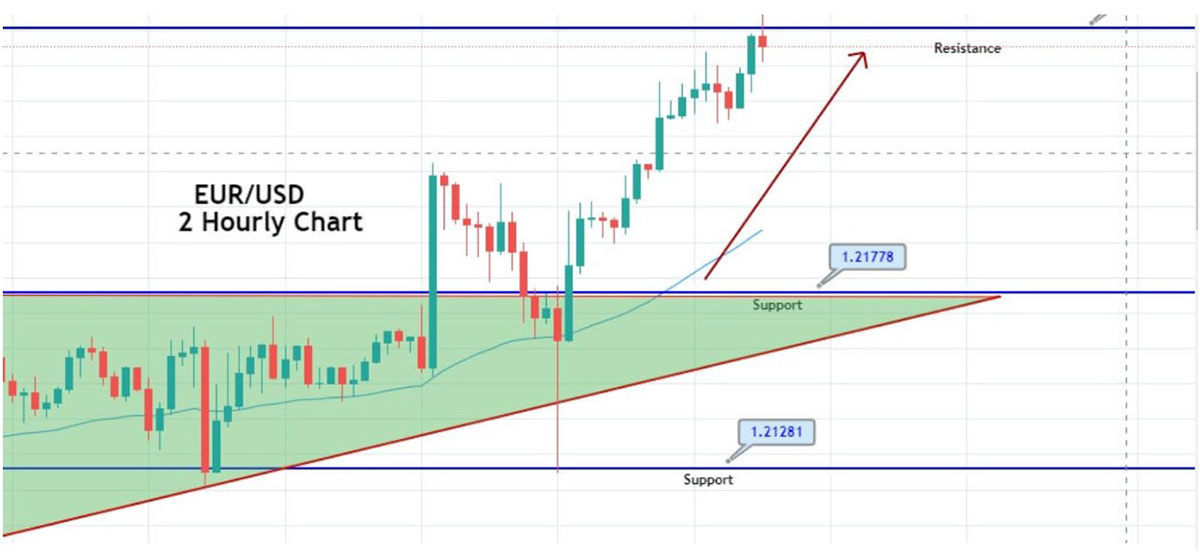
- Ascending/Descending Triangle: Continuation patterns where the price moves within a converging range. Ascending triangles have a flat top and a rising bottom, while descending triangles have a flat bottom and a descending top.
- Candlestick Patterns: These are specific formations made up of candlestick bars that provide insights into price behavior, such as doji, engulfing patterns, and shooting stars.
Overall, chart patterns serve as a valuable tool in a trader's toolbox, helping them interpret market dynamics, manage risk, and make more informed decisions in the complex world of financial markets.
Today we are going to learn everything about the ascending triangle pattern; what is an ascending triangle, how to trade it and its formation.
KEY TAKEAWAYS
- Chart patterns serve as a valuable tool in a trader's toolbox, helping interpret market dynamics, manage risk, and make more informed decisions in the complex world of financial markets.
- An ascending triangle is a significant pattern in technical analysis, a method used by traders to forecast potential price movements in financial markets.
- Traders often estimate a potential price target for the breakout based on the height of the triangle.
What is an Ascending Triangle
So what is an ascending triangle pattern?
Imagine you're looking at a puzzle piece on a trading chart - that's what an ascending triangle is. It's a special shape that shows a hidden battle between people who want to buy and people who want to sell something.
Now, this shape looks like a triangle, but with one side straight along the top and the other side slanting upwards. It's like a secret code that traders use to guess what might happen next in the market. When this special shape appears, it often means that the people who want prices to go up are getting stronger. This could be a clue that the prices might actually go up more.
Think of it like finding a treasure map that gives hints about where the market might go. This special triangle shape can tell traders a lot about how the market is changing and where prices might move.


Let's explore this interesting shape, understand its story, and see how it helps us figure out what might happen with prices in the market.
Triangle Pattern Trading
Triangle pattern trading is a strategy that involves using specific geometric formations on trading charts to make predictions about future price movements. These formations resemble triangles and provide insights into potential shifts in market trends.
There are three main types of triangle patterns:
- Ascending Triangle: This pattern has a flat upper trendline and a rising lower trendline. It suggests that buyers are becoming more aggressive and might eventually push the price higher.
- Descending Triangle: In this pattern, the upper trendline slants downward while the lower trendline remains flat. It indicates that sellers might be gaining strength, potentially leading to a downward price movement.
- Symmetrical Triangle: This pattern features both the upper and lower trendlines converging towards each other. It suggests a period of indecision in the market, with buyers and sellers being balanced.
Eventually, a breakout in either direction can signal a new trend. Traders who use triangle pattern trading look for breakouts – moments when the price moves beyond one of the trendlines. This movement is seen as a potential confirmation of the pattern's prediction.
Traders often use other technical analysis tools alongside these patterns to increase the accuracy of their predictions. By studying triangle patterns and how they interact with other market factors, traders attempt to make more informed decisions about when to enter or exit trades.
However, it's important to note that no strategy is foolproof, and trading always carries risks. An ascending triangle is a significant pattern in technical analysis, a method used by traders to forecast potential price movements in financial markets. This pattern provides insights into the dynamics between buyers and sellers.
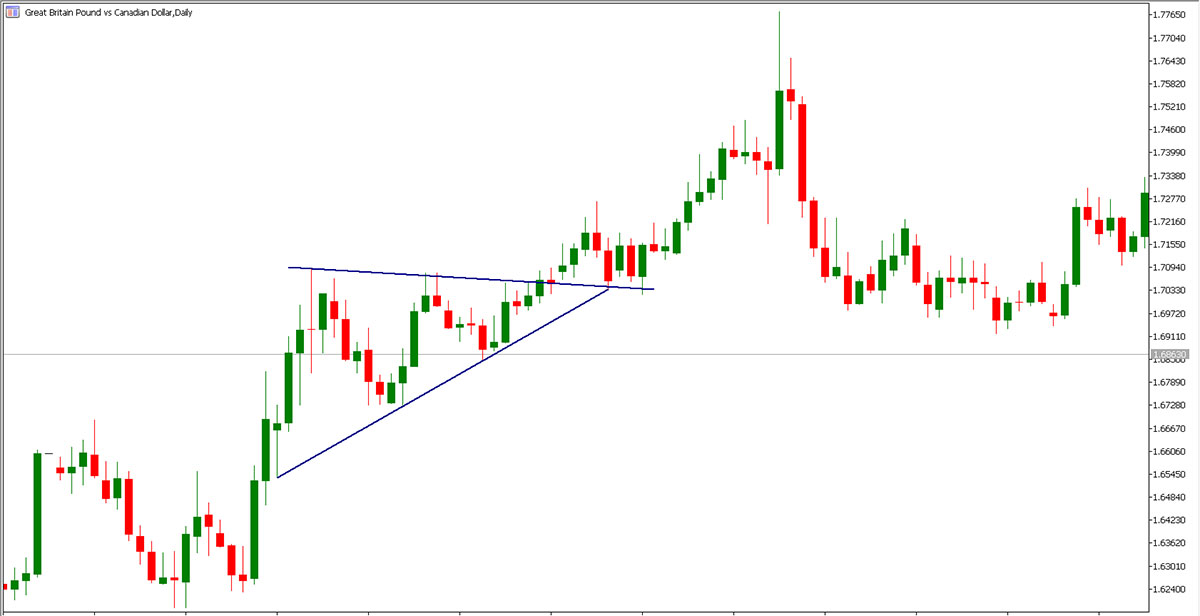
Imagine looking at a chart that shows the price of a stock or any other financial asset over time. An ascending triangle pattern appears when you connect the high points of the price with a straight line (the upper trendline) and the low points with a slanted line that is moving upwards (the lower trendline).
This forms a triangle shape on the chart. Here's what the ascending triangle pattern can tell us:
- Battle of Buyers and Sellers: The pattern indicates a kind of tug-of-war between buyers and sellers. The upper trendline represents a price level where sellers are active, while the rising lower trendline shows that buyers are gradually stepping in and preventing the price from falling too much.
- Potential Breakout: As the buyers keep pushing the price higher and the range between the trendlines narrows, traders start watching for a breakout. A breakout occurs when the price breaks through the upper trendline, suggesting that buyers have become dominant and might push the price even higher.
- Price Target: Traders often estimate a potential price target for the breakout based on the height of the triangle. They measure the distance between the initial low point and the upper trendline. This distance is then added to the breakout point to provide a projected price target.
- Confirmation: For traders, a successful breakout above the upper trendline confirms the pattern's prediction of potential upward momentum. However, it's important to wait for confirmation, as false breakouts can happen.
- Volume: Observing trading volume can provide additional insights. Generally, an increase in trading volume when the breakout occurs can signal strong market conviction.
Remember that while the ascending triangle pattern can offer valuable insights, it's not a guaranteed predictor of future price movements. Traders often combine this pattern with other forms of analysis, such as candlestick patterns or technical indicators, to make more well-rounded decisions. As with any trading strategy, risks are involved, and careful consideration of market conditions is crucial.
Ascending Triangle Formation
The ascending triangle is a positive chart pattern that shows up when an asset's price stays between a flat line on top and a slanted line that's moving up. This shape suggests that the buyers are in charge and that the price could go up more after this in-between time.
Here's how to spot an ascending triangle:
- Find a trend: This shape usually happens when prices are going up. But it can also show up when things are staying steady or even when prices were falling before.
- Draw a flat line: Connect the highest points during this in-between time.
- Draw a slanted line: Connect the lowest points during the same time, but this time it's going up like stairs.
- Check the lows: Prices should go up a little bit each time and touch the slanted line.
- Check the highs: Prices should be about the same, forming a flat line at the top.
- Watch the volume: When prices get close to the flat line, more people might start trading. You'll see this by watching how much trading is happening.
- Get ready for a breakout: Prices will finally break above the flat line, and usually, a lot more trading will happen at the same time.

In the end, the price will be in the middle of the flat and slanted lines, but it will break above the flat line, usually with a lot of trading.
This triangle pattern is a helpful sign that prices might go up. But remember, patterns aren't always right, so it's smart to use other tools and techniques to make good decisions.
Target price
Following an ascending triangle pattern formation the price is generally believed to rise at least to its target level, calculated as follows:
T = R + H, Where:T – target price;
R – resistance (horizontal line);
H – pattern’s height (distance between support and resistance lines at pattern’s origin).
Bottom Line on Ascending Triangle Pattern
The ascending triangle pattern is a significant tool in technical analysis, offering insights into market dynamics and potential price movements. This pattern forms when an asset's price oscillates between a flat upper trendline and a slanting lower trendline moving upward.
This triangular shape suggests a battle between buyers and sellers, with buyers gradually gaining control. Traders watch for a breakout above the upper trendline, indicating potential upward momentum and a target price projection.
However, successful trading requires caution and combining this pattern with other analyses, as it's not an absolute predictor. Understanding the ascending triangle pattern's dynamics empowers traders to make informed decisions, though market conditions and risk factors always require careful consideration.
Forex Indicators FAQ
What is a Forex Indicator?
Forex technical analysis indicators are regularly used by traders to predict price movements in the Foreign Exchange market and thus increase the likelihood of making money in the Forex market. Forex indicators actually take into account the price and volume of a particular trading instrument for further market forecasting.
What are the Best Technical Indicators?
Technical analysis, which is often included in various trading strategies, cannot be considered separately from technical indicators. Some indicators are rarely used, while others are almost irreplaceable for many traders. We highlighted 5 the most popular technical analysis indicators: Moving average (MA), Exponential moving average (EMA), Stochastic oscillator, Bollinger bands, Moving average convergence divergence (MACD).
How to Use Technical Indicators?
Trading strategies usually require multiple technical analysis indicators to increase forecast accuracy. Lagging technical indicators show past trends, while leading indicators predict upcoming moves. When selecting trading indicators, also consider different types of charting tools, such as volume, momentum, volatility and trend indicators.
Do Indicators Work in Forex?
There are 2 types of indicators: lagging and leading. Lagging indicators base on past movements and market reversals, and are more effective when markets are trending strongly. Leading indicators try to predict the price moves and reversals in the future, they are used commonly in range trading, and since they produce many false signals, they are not suitable for trend trading.

Not sure about your Forex skills level?
Take a Test and We Will Help You With The Rest
You can see the graphical object on the price chart by downloading one of the trading terminals offered by IFC Markets.

Was this article helpful?
 You can study CFD trading more thoroughly and see CFD trading examples in the section How To Trade CFDs Visit Educational Center

