- Education
- Forex Technical Analysis
- Basic Concepts
- Fibonacci Retracement Levels
How to Use Fibonacci Retracement - Fibonacci Retracement Levels
What is Fibonacci Retracement
A Fibonacci retracement is a technical analysis tool that uses percentages and horizontal lines, these lines are drawn onto price charts, to identify possible areas of support and resistance.
There is a certain pattern that prices follow, a pattern that consistently uccures is consolidation between price ranges. Financial assets are often traded in a tight range, consolidating a recent move, and then move to another range and repeat the process. This pattern even repeats during market trends, prices tend to target specific levels before moving on to the next region.
Fibonacci retracement analysis can be used to confirm entry level and determine stop-loss level.
KEY TAKEAWAYS
- Fibonacci retracement is a technical analysis tool that uses percentages and horizontal lines, these lines are drawn onto price charts, to identify possible areas of support and resistance.
- Fibonacci retracement analysis can be used to confirm entry level and determine stop-loss level.
- Fibonacci retracement levels are 23.6%, 38.2%, 61.8% and 78.6% (50% is used as well as a level, yet unofficially).
- There are two ways to use retracement levels for entries; entering at each level, or waiting for the price to go back in the original direction first.
How to Use Fibonacci Retracement
Whenever there is a sharp move in price, up or down, there is usually a high chance of a pullback before it continues in the direction of the main trend. So this analysis can be applied after sharp price movement and you are expecting price correction.
Fibonacci Retracement levels are a great way of identifying new positions in the direction of the trend.
23.6%, 38.2%, 50% and 61.8% are important Fibonacci ratios that help identify a possible price retracement, as we mentioned earlier, usually a 23.6% retracement is less deep than a 61.8% retracement. Which is considered the golden ratio and is an important level. ... 38.2% -50% is moderate correction. Typically, if a stock bounces off the 38.2% Fibonacci retracement level, the underlying strength of the previous move is considered strong.
You can use Fibonacci Retracement levels to enter the position and there are two ways to do that:
- Enter as the price reaches each level.
- Wait until the price finds support or resistance at these levels first, and then enter.
Note: 61.8%, 50.0%, 38.2% are potential long entry levels
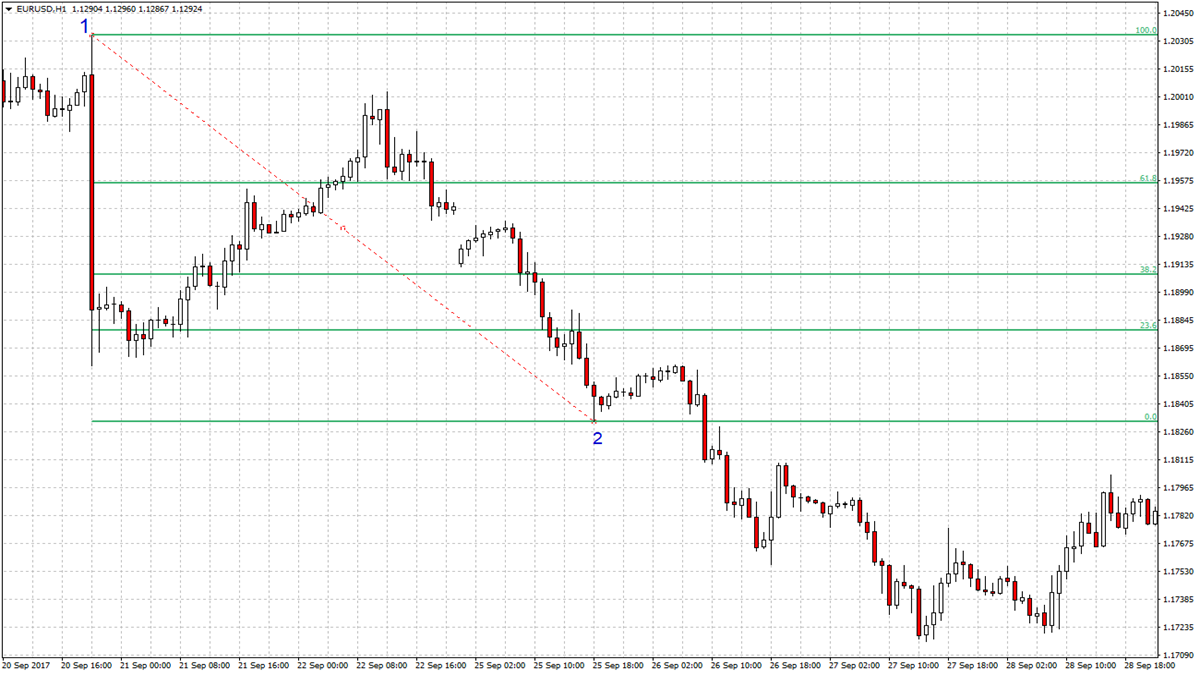
The Fibonacci tool is applied manually. When measuring a downtrend, you need to apply the tool at the start of the move to the end – it is always applied from left to right. The tool is drawn starting at the top and ends at the bottom, drawn from left to right. You can see from the chart below;

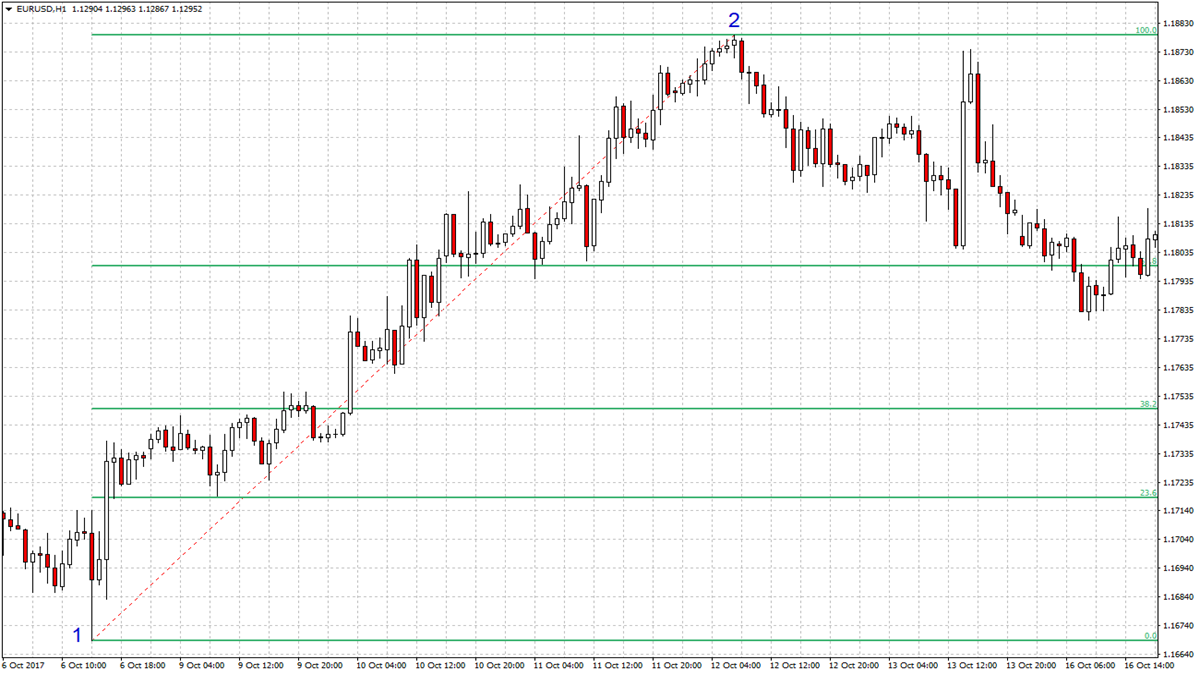
For upward movement, the tool is applied at the bottom and ends at the top - again, it is always applied from left to right. Check out the graph:

Fibonacci Retracement Levels
Fibonacci retracement levels are horizontal lines, they indicate where support and resistance are likely to happen. They come from the Fibonacci sequence, a mathematical formula that appeared in the early 1400s. With this sequence you will be able to formulate support and resistance levels, which in turn can be used in your risk management framework.
Fibonacci retracement levels can be used on their own as well as combined with other technical analysis tools.
Each level is associated with a percentage. Percentage is how much the price has retraced from the previous move. Fibonacci retracement levels are 23.6%, 38.2%, 61.8% and 78.6% (50% is used as well as a level, yet unofficially).
Fibonacci retracement lines can be drawn between any two significant price points, such as a high and a low, and an indicator will create the levels between those two points. For example, if the price rises $10 then drops $3.82, then it retraced 38.2% which is Fibonacci number.
Fibonacci Numbers
The Fibonacci sequence of numbers became popular in Europe thanks to an Italian mathematician Leonardo Pisano (Fibonacci), although, this sequence had been known in the East long before him. "The sequence presents a series of numbers, where each subsequent number is the sum of the previous two:
0, 1, 1, 2, 3, 5, 8, 13, 21, 34, 55, 89, 144, 233, 377……
The Fibonacci sequence of numbers extends to infinity and contains many unique mathematical properties.
- If any of the numbers of this sequence is divided into the following number, then the result will be approximately 0.618 (13/21=0.619, 21/34=0.617, 34/55=0.618).
- If any of the numbers of this sequence is divided into the previous number, then the result will be approximately 1.618 (21/13=1.6153, 34/21=1.6190, 55/34=1.6176).
Last sequence was used in the financial market by the famous trader Ralph Elliott. In his theory of waves, Ralph noticed that the ratio of the height of the next wave to the previous one is approximately equal to 1,618.

How to Trade with Fibonacci
Fibonacci retracement levels are most effective when used within a broader strategy, with a combination of several indicators there is a higher chance to more accurately identify market trends. The more factors backing the situation in the market the better.
Fibonacci levels can be used in many different trading strategies, for example:
- Using Fibonacci retracement lines with the MACD indicator. When a security’s price touches an important Fibonacci level a position can be opened in the direction of the trend.
- Using Fibonacci levels with the Stochastic indicator. This two-line indicator can help identify overbought and oversold levels. The strategy looks for a key signal from the stochastic indicator when the price touches an important Fibonacci level.
- Fibonacci retracement levels can be used across multiple timeframes, but are considered to be most accurate across longer timeframes.
Fibonacci levels can be useful if you want to buy a particular security but missed a recent uptrend. In this situation, you can wait for a rollback. By charting Fibonacci ratios such as 61.8%, 38.2% and 23.6%, you can identify possible retracements and open potential trading positions.
How to Calculate Fibonacci Retracement Levels
Fibonacci retracement levels are percentages of whatever price range is chosen. So you can see there is nothing to calculate when it comes to retracement levels.
Let’s check out an example, shall we…
We have:
High Range (H) = 1000
Gross Margin (G) = 900
Have to find:
Fibonacci Retracement Levels
Here is how:
Fibonacci Retracement Uptrend
Uptrend | |
Retracements | |
| 0% | 1000 - (100x0) |
| 23.6% | 1000 - (100x0.236) |
| 38.2% | 1000 - (100x0.382) |
| 50% | 1000 - (100x0.5) |
| 61.8% | 1000 - (100x0.618) |
| 76.4% | 1000 - (100x0.764) |
| 100% | 1000 - (100x1) |
Fibonacci Retracement Downtrend
Downtrend | |
Retracements | |
| 0% | 900+ (100x0) |
| 23.6% | 900+ (100x0.236) |
| 38.2% | 900+ (100x0.382) |
| 50% | 900+ (100x0.5) |
| 61.8% | 900+ (100x0.618) |
| 76.4% | 900+ (100x0.764) |
| 100% | 900+ (100x1) |
And the result:
Fibonacci Retracement Uptrend
Uptrend | |
Retracements | |
| 0% | $1000 |
| 23.6% | $976.4 |
| 38.2% | $961.8 |
| 50% | $950 |
| 61.8% | $938.2 |
| 76.4% | $923.6 |
| 100% | $900 |
Fibonacci Retracement Downtrend
Downtrend | |
Retracements | |
| 0% | $1000 |
| 23.6% | $976.4 |
| 38.2% | $961.8 |
| 50% | $950 |
| 61.8% | $938.2 |
| 76.4% | $923.6 |
| 100% | $900 |
Bottom line on Fibonacci Retracement Levels
The Fibonacci approach shouldn't be used solely, traders need to use it in combination with other technical analysis tools. That way they will have a fuller picture of the situation in the market. This approach can give an extra level of insight to potential market turning points. Fibonacci retracement levels can be used to make trading decisions in the same way as normal horizontal support and resistance levels.
Remember these levels are best used as a tool within a broader strategy…
Fibonacci Retracements are a guide
You can apply Fibonacci Retracement tool on any timeframes, use it to see how far a pullback is likely to retrace after another trending wave begins. Remember, there is no guarantee the price will stop at a level just because it is shown on the chart.

Not sure about your Forex skills level?
Take a Test and We Will Help You With The Rest
How to use Fibonacci Retracement Levels in trading platform
You can see the graphical object on the price chart by downloading one of the trading terminals offered by IFC Markets.

Was this article helpful?
 You can study CFD trading more thoroughly and see CFD trading examples in the section How To Trade CFDs Visit Educational Center

