- Innovations
- Articles on application of PCI
- Portfolio Trading
Stock Portfolio Construction | Stock Portfolio Analysis - Pportfolio Quoting Method PQM
Pportfolio Quoting method allows you to construct any combination of assets from a set of available instruments. In this article we would like to draw attention to the U.S. stock market, choose a few securities, build a chart of the resulting portfolio and analyze its behavior over several recent years.
As known, the financial crisis that erupted in 2008, has led to serious consequences for the global financial system and significant losses to investors. For four and a half years the world has been trying to recover, and only recently signs of economic recovery in the world's largest economy - the United States - have begun to appear.
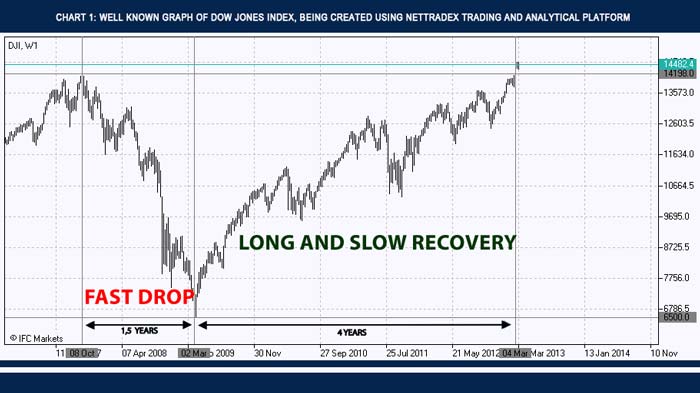
One of the oldest and most well-known stock market indices - Dow Jones Industrial Average - only in March 2013 was able to fully recover and reach the pre-crisis peak of autumn 2007, above the level of 14,000 points. Thus, for one year and a half (Fall 2007 - Spring 2009), the index lost one half of its value, and it took four years to regain lost positions.
Chart 1: Well known graph of Dow Jones Index, being created using NetTradeX trading and analytical platform

With the help of PQM method we will try to find out whether there was such a portfolio of shares that would protect our potential investments in U.S. stocks from impairment during the crisis, and to evaluate its profitability.
As it is known, during the financial crisis, financial companies suffered most. In this regard, among all the included stocks in the index Dow Jones Industrial Average we selected stocks of companies representing other sectors of the economy, in particular - companies involved in the production of consumer goods, in development and production of high-tech goods, food production, as well as media companies. The following were included in our sample (with appropriate random weights):
- Walt Disney Company (DIS - 20%)
- Home Depot Inc. (HD - 20%)
- Honeywell International Inc. (HON - 15%)
- International Business Machines Corporation (IBM - 15%)
- Coca-Cola Company (KO - 10%)
- McDonald’s Corporation (MCD - 20%)
With the help of PQM method a portfolio is created consisting of the six above-mentioned securities with specified weights. Assume that the current value of the portfolio is $ 10,000, then $ 2,000 is invested in Walt Disney Company, Home Depot and McDonald's Corporation (total investment of $ 6,000); 1500 dollars - in Honeywell International and International Business Machines Corporation (total investment of $ 3,000); $ 1,000 - in Coca-Cola Company.
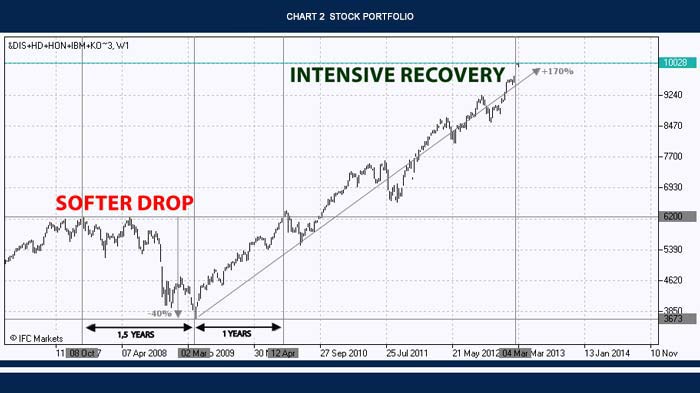
The chart of the Portfolio allows retrospectively assess its performance and profitability over the past few years. In pre-crisis years 2007 and 2008 the value of our portfolio was below the level of U.S. $ 6200, and during the crisis, it dropped to 3673 dollars. We can already draw first conclusions. First, the value of the portfolio during the crisis fell by about 40%, showing a slightly better result than the index Dow Jones Industrial Average. Second, a full recovery of the portfolio value did not take four years, but only one year. Finally, in the post-crisis period the portfolio gained more than 170% (the figure is calculated based on the latest value relative to the minimum value in March 2009).
Chart 2: Stock portfolio NetTradeX trading and analytical platform

Of course, the value of the created portfolio has been seriously affected by the financial crisis, but its rapid recovery is really impressive and gives us hope for good results in the future.
The next step of our analysis will focus on comparison of portfolio dynamics with the market. In our case, the market will be represented by the index Dow Jones Industrial Average. We have noticed that the portfolio showed less negative results during the crisis and a more rapid recovery. Let’s plot a chart of the portfolio relative to the index in order to confirm our assumption of a higher return from investment in the portfolio than in the index, and see how much the portfolio has outperformed the market.
To do this, PCI will be used: the same portfolio of stocks with the same asset weights and current investment value of U.S. $ 10,000 is built. In the quotation a portfolio of $ 10,000 is invested in the index Dow Jones Industrial Average.
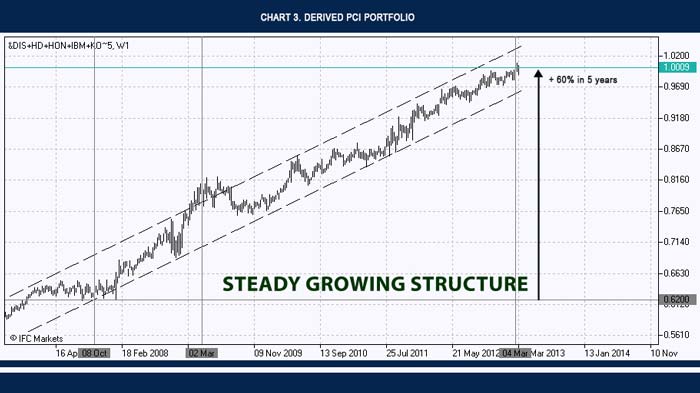
Chart 3: Derived PCI portfolio
Judging from the above chart, the portfolio has been systematically beating the market. Since 2006, we can observe a constant growing structure. Thus, before and during the crisis, and even during the period of recovery our portfolio either fell less than the index, or grew stronger than the index. If trying to evaluate the behavior of the portfolio relative to the index in a qualitative manner, the portfolio has been outperforming the index by about 10% annually over the past five years.
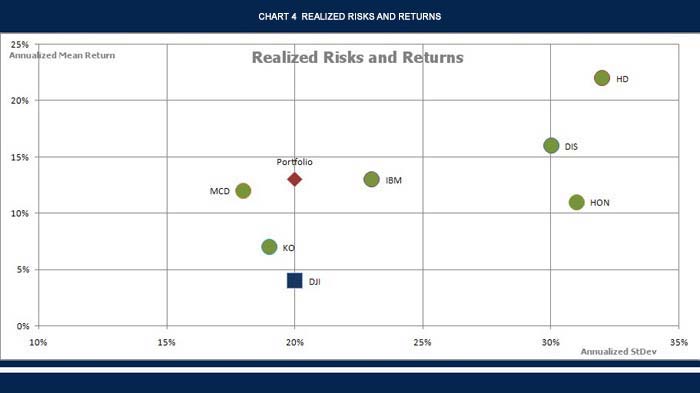
Portfolio construction, as it is known, provides a major advantage - the diversification of risks. In quantitative terms, this means finding a balance between return and volatility. Scatter plot of realized returns and standard deviations will help to visualize the benefits of diversification. Over the past five years, the index Dow Jones Industrial Average showed an average annual return of 4%, with a standard deviation of return about 20%. We constructed a portfolio characterized by the same level of risk (the same 20% for the standard deviation), but much higher levels of return - an average of 13% per year.
Chart 4: Realized risks and returns
At the same time, the stocks of our selected companies showed higher, compared to the index, profitability, but the measure of the risk in terms of standard deviation turned out to be different in relation to the index. For example, the standard deviation of the returns of Home Depot stocks was the highest (32%), McDonald's stocks - the lowest (18%). The question of finding a balance between return and risk largely depends on individual investor's characteristics and his requirements of portfolio return and his ability to bear risks. Generally, these two concepts have a direct relationship: the higher the required rate of return, the higher the risk. At this stage, we did not set the task of finding the optimal portfolio, but the task of drawing up a portfolio that would systematically beat the market, at least in recent years is resolved.
With the help of PQM method, we can also build a relative dynamics of value of each of the considered stocks in relation to the index Dow Jones Industrial Average. But none of the charts gave as "smooth" growing curve, as our portfolio. In addition, "drawdowns" or protracted periods of side movement may be observed on these charts.
At the beginning of the study we tried to select stocks from the composition of the index Dow Jones Industrial Average, which value has recovered relatively quickly after the financial crisis of 2008, or which have been less affected by the financial crisis. With PQM method we have received a portfolio, which structure can be assuredly optimized, showing a significant increase in the post-crisis period.
However, after comparing the dynamics of the portfolio with the dynamics of the index, even more interesting finding was observed. Using the same PCI we got a pretty smooth growing structure, implying that the portfolio not only showed a significant increase after the crisis, but also has been systematically beating the index before and during the crisis, and during the period of recovery as well.
Analysis of returns and standard deviations of all analyzed instruments confirmed our findings quantitatively. With the same level of risk with the index, realized return of our portfolio significantly exceeded the return of the index. It should again be noted that at this stage we do not claim that even with the current selection of assets the structure of the portfolio is optimal. It is possible that maintaining the current level of risk of the portfolio another portfolio with a higher return can be found.
Further analysis of the portfolio and its behavior relative to the index Dow Jones Industrial Average may help to predict its future trend. With the help of the PCI it is possible to build a huge number of different portfolios and analyze them in relation to each other. In combination with the analysis of macroeconomic factors, the analysis of issuers, technical approach, PCI opens entirely new horizons.
Previous articles
- Fourth basic tenet of Dow Theory: serving the investor
- Portfolio spread based on continuous futures
- Sharpe Portfolio | "The Three Leaders" - DJIA, S&P500, Nasdaq 100
- Portfolio Quoting Method for Analysis of "Good" and "Bad" Portfolios
- Portfolio Optimization through PQM Method (Part 2)
- Portfolio Optimization through PQM Method (Part 1)
